TRACKDOTS BY API DOTS
TrackDots transforms workforce activity, time, productivity, attendance, and project data into operational intelligence to optimize workforce utilization and understand how work gets done.
Wednesday, July 8, 2026
One dashboard for time, activity, payroll, and people.
Accurate time tracking across every task and project.
Real visibility into applications, focus, and idle time.
Attendance-based payroll, leave, and deductions in sync.
A single source of truth for workforce performance.
Organizations need more than workforce activity insights; they need to develop a deep understanding of workforce capacity utilization, time allocation, productivity, and project performance.
TrackDots integrates workforce activity, productivity, attendance, projects and tasks, and payroll into a single platform to deliver the insights needed to evaluate workforce performance.

Every tracked hour is automatically split into active and idle time, updated live — so reported hours always reflect real, honest work.

Surface deep, uninterrupted focus time automatically — no timers, no manual tagging, just an honest read on real concentration.

See exactly which applications and websites teams spend time in, ranked by usage and classified as productive or not.

Attendance and productivity data connected in one view, so patterns in punctuality, leave, and output are never analyzed in isolation.
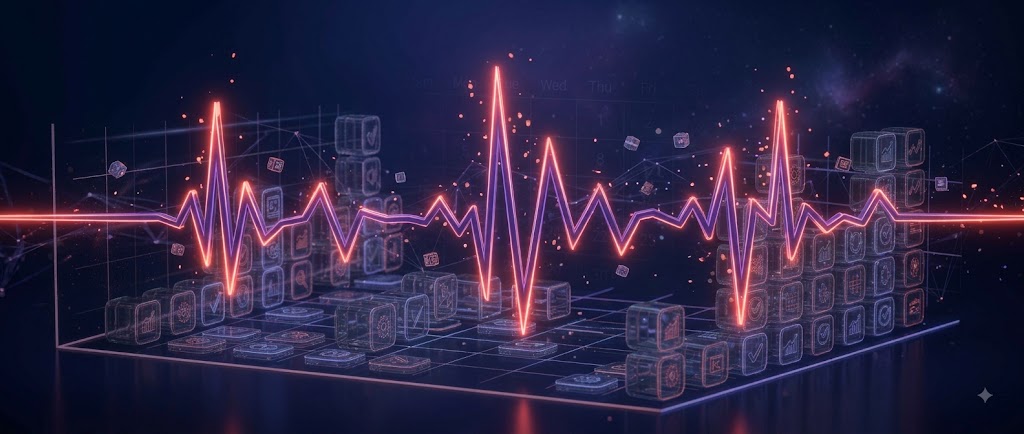
Spot workforce members whose activity swings unpredictably day to day, so utilization gaps get addressed before they affect delivery.

Understand how teams structure their day — work blocks, break patterns, and time-of-day habits — to plan schedules that actually match how people work.

Automatic anomaly detection flags unusual productivity, attendance, or activity patterns across a rolling window, so managers know exactly where to look.
Every hour worked against a project or task is captured automatically as it happens, with no manual timesheets or end-of-day guesswork required from your team.
See exactly how work is distributed across tasks, teams, and workstreams so you always know who is carrying the load and where support is needed.
Track spend against budget in real time and get early visibility into burn rate trends before overruns happen and eat into project margins.
Measure how fast work actually moves through your pipeline and how evenly capacity is spread across the team so bottlenecks surface early.
Know exactly what will finish on time, what is at risk, and what needs attention now, based on real completion trends instead of guesswork.
Get a single, honest signal for whether a project is on track, combining budget, velocity, and utilization data into one clear view.
This allows organizations to make better decisions on project staffing, budgeting, and timing based on actual utilization and productivity data.
Individual productivity is a useful signal but does not provide much context on historical anomalies, attendance trends, focus, idle time, and utilization. TrackDots evaluates productivity, attendance, focus, and utilization to identify patterns and anomalies across multiple dimensions.
Using anomaly detection, organizations can assess workforce performance with a focus on atypical productivity behaviors across a 30-day window to detect patterns warranting additional scrutiny.
This helps managers focus on specific patterns affecting productivity, time, and attendance rather than random daily fluctuations.
Patrice has worked evenings and weekends for 11 of the last 14 days. Consider redistributing workload.
Productivity is not the only indicator of a healthy workforce performance. Tracking overtime, breaks, time of day, evenings, weekends, and productivity can be used to determine the risk of unsustainable workloads.
By evaluating these signals over a rolling 14-day period, TrackDots can alert managers to potential risks before they affect overall productivity.
Not all productive work looks the same. Reading a report, analyzing data, attending a meeting, and writing code all produce different levels of computer activity.
TrackDots identifies activity that may be low-quality and lets you decide how it should be handled.
Recognize work with low keyboard or mouse activity.
Identify time with unusually low activity.
Treat approved meeting time as productive.
Choose whether low-quality time affects productivity scores or tracked hours.
Get a more accurate view of productivity by putting activity into context.
Attendance-based salary, LWP, pro-ration, bonuses, and deductions.
Attendance, leaves, working-hour thresholds, and related policies.
Project budgets, burn rate, task allocation, velocity, and forecasting.
CSV / PDF reports with automated distribution schedules.
Read-only API access to workforce attendance, activity, productivity, idle time, pauses, task gaps, and related data.
Managers and employees benefit from a transparent tracking environment. With the ability to review their own activity, work diary, and screenshots, while having direct control over pause and stop tracking and identification of work and meeting time.
TrackDots captures activity signals without tracking employee work content. This means that while activity counts, mouse activity, applications, and window titles are captured, the following remain protected:
Optimize developer productivity, focus time, project allocation, application utilization, and workforce capacity.
Improve project profitability with insights into task allocation, project hours, utilization, budgets, and delivery velocity.
Monitor workforce attendance, utilization, productivity, idle time, and schedule adherence.
Understand consultant utilization and project allocation while maintaining visibility into workforce capacity and delivery.
Unify workforce activity, attendance, leave, payroll, and employee records within a single platform.
Maintain structured visibility into time allocation, project activity, and billable work.
Track staff scheduling, administrative productivity, and support-team utilization across facilities.
Monitor operations, support, and fulfilment teams with visibility into workload and schedule adherence.
Keep utilization, productivity, and process adherence visible across back-office and operations teams.
Understand how academic operations, content, and support teams allocate their time and capacity.
Track distributed sales, documentation, and back-office teams with attendance and productivity insight.
Bring office, planning, and coordination teams into one view of utilization and operational output.