
Top
Search
People also search for:

Stay Inspired with Instagram





It is November in a distribution warehouse outside Chicago, Illinois. The warehouse manager is staring at 40,000 units of a consumer electronics product that nobody is buying. Three months earlier, the same product was backordered for four to six weeks. The company lost $2.3 million in sales to competitors during that window. Now it is carrying $1.8 million in overstock that will clear only with a 40% markdown. Total damage from one forecast cycle: over $4 million.
The forecast was built in a spreadsheet last updated in 2009. It incorporated 18 months of sales history and the merchandising team’s judgment. It did not incorporate weather data, competitor pricing, social media sentiment, or the supply chain disruption that shifted a competing product’s delivery timing. It never has.
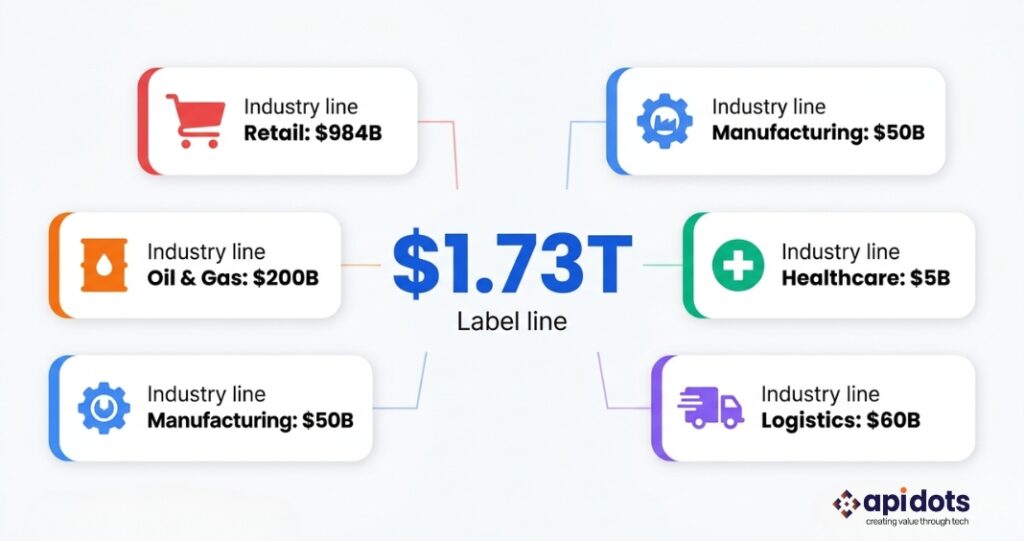
The scene above is not unusual. IHL Group research puts the global cost of this type of forecast failure — what it calls inventory distortion — at $1.73 trillion annually. That figure represents the combined value of goods sitting in the wrong warehouse, being marked down because demand was overestimated, or missing from shelves because demand was underestimated. It has not decreased despite 30 years of ERP investment and an entire industry of demand planning software. It has grown, because the pace of market change has grown faster than the tools designed to track it.
This blog explains what AI demand forecasting is, how it works through four specific and interdependent layers, what it costs, what it returns, and how a business can assess whether it is ready to implement it. For the full technical foundation behind AI-powered business systems.
This guide is for operations leaders, inventory planners, and technical decision-makers at mid-size to enterprise companies evaluating AI demand forecasting for the first time or reconsidering a failed implementation.
Inventory distortion is not just overstock or just stockouts. It is both conditions existing simultaneously across different products and locations within the same business. A retailer with 200,000 SKUs across 300 stores will have products it cannot shift and products it cannot keep in stock at the same time, in the same week, managed by the same planning team. The $1.73 trillion annual figure from IHL Group’s inventory distortion research captures the combined financial damage of both conditions: the carrying costs and markdowns from overstock, and the lost revenue and customer defection from stockouts.
Traditional forecasting tools have not solved this problem because they cannot. A human analyst managing 2,000 SKUs across 50 stores cannot simultaneously monitor weather data, social media sentiment, competitor pricing movements, local event calendars, and economic indicators for each product in each location every day. An AI model can. This is not a marginal capability improvement — it is a structural change in what is computationally possible. The analytical ceiling of a spreadsheet is determined by how much data a person can process. The analytical ceiling of an AI model is determined by how much data can be fed into it. Those two ceilings are not comparable in scale.
The financial damage by industry makes the scope of the problem specific rather than abstract:
| Industry | Annual cost of forecast failure | Primary cause |
|---|---|---|
| Retail | $984 billion (IHL Group) | Stockouts and overstock combined — both conditions exist simultaneously for different SKUs |
| Oil and gas | $200 billion (industry research) | Refinery overproduction and underproduction cycles—storage costs and margin losses. Full analysis: AI for oil and gas |
| Manufacturing | $50 billion US (industry estimate) | Production planning errors — excess inventory from overproduction and emergency procurement premiums from underproduction |
| Healthcare | $5 billion US (industry research) | Expired medical supplies — PPE, pharmaceuticals, and surgical consumables ordered on inaccurate demand projections |
| Logistics | $60 billion US (industry estimate) | Empty miles and wasted capacity from poor demand visibility |
The $1.73 trillion figure has not decreased because the solutions businesses have deployed — better spreadsheets, more dashboards, larger planning teams — attack the symptom rather than the cause. The cause is the structural inability of linear statistical models to process the volume and variety of signals that actually drive demand in a complex market. AI demand forecasting is the first category of tool designed specifically to address that structural limitation. Not to improve on the spreadsheet. To replace the approach entirely.
AI demand forecasting is a software system that uses machine learning—algorithms that learn patterns from historical and real-time data—to predict how much of something will be needed, where it will be needed, and when. It continuously updates predictions as new market signals arrive.
A weather forecast is the most useful comparison for a non-technical audience. A traditional weather forecast used historical averages and produced a monthly estimate based on what had happened in previous Novembers. A modern AI weather forecast processes real-time satellite imagery, atmospheric pressure readings from thousands of sensors, ocean temperature data, and the outcomes of millions of previous weather system simulations—and updates its prediction every hour as new data arrives. AI demand forecasting does the same thing for business demand: historical sales patterns are combined with real-time signals — weather, competitor pricing, economic conditions, social media trends—producing a prediction that updates daily or weekly as new data arrives, rather than monthly when the planning team has time to run the model.
What AI demand forecasting is not is equally important to understand. It is not a spreadsheet with more rows. The architecture is fundamentally different: a spreadsheet applies a formula to historical data; a machine learning model discovers the relationships between variables from data without being told in advance what formula to use. For demand problems with 200 interacting variables — Walmart’s situation — no formula can be specified in advance. The model must discover the relationships. That is only possible with machine learning.
It is not a BI dashboard. A BI dashboard shows better visualizations of data you already had. A forecasting system produces predictions of data you do not have yet — specifically, what demand will be next week, next month, next quarter, and what the range of uncertainty around that prediction is.
And it is not a certainty machine. Demand is inherently uncertain. AI reduces the range of that uncertainty by 20 to 50% according to McKinsey. A good AI forecasting system communicates the remaining uncertainty honestly—through confidence intervals — and allows inventory planning decisions to be calibrated accordingly. That calibration is where most of the financial value is recovered. For a detailed look at how production AI systems are built and operated, the API DOTS AI and ML development services page covers the full technical scope.
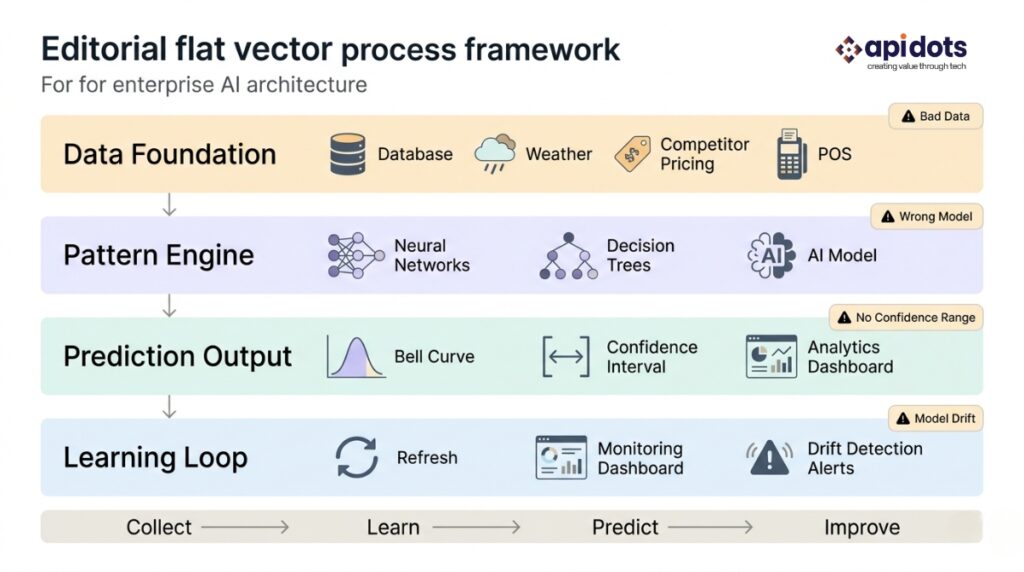
Most explanations of how AI demand forecasting works describe a linear process: gather data, train model, generate forecast. That description is accurate but dangerously incomplete. A production AI demand forecasting system that reduces forecast error and maintains that reduction over three years is built from four interdependent layers. Remove any one layer and the system degrades. Understand all four and you have a framework for evaluating any AI forecasting implementation — including vendor proposals and your own current readiness.
The data foundation is everything the AI model will learn from. For a retailer: point-of-sale transactions, inventory records, promotional calendars, store attributes, and external signals—weather, local events, competitor pricing, economic indices. For a manufacturer: production orders, customer purchase histories, raw material lead times, and capacity constraints. The quality and completeness of this data determine the ceiling of what the model can achieve. A model cannot learn relationships that the data does not contain.
Most businesses have deep data on what is sold. Very few have complete data that captures why it sold. A retailer with five years of sales history but no record of which weeks ran promotions has a depth problem. An AI model trained on that data will attribute the promotion lift to weather or seasonality rather than the promotion — and its inventory recommendations will systematically miss promotion effects quarter after quarter. The completeness problem is harder to detect than the volume problem and more damaging to model accuracy.
Target Corporation’s AI demand foapidots-ai-demand-forecasting-implementation-process recasting team has described publicly that their system incorporates real-time demographic data, credit card trend signals, and zip code-level economic activity data alongside traditional sales history—drawing from over 40 distinct data sources. The investment in data completeness, not model sophistication, is what separates Target’s forecasting capability from the average retailer’s. The same principle applies in every industry. For oil and gas demand forecasting specifically, the data foundation challenge is even more acute—the full analysis of how AI applies across upstream, midstream, and downstream operations documents the data architecture required for production energy forecasting.
When Layer 1 is incomplete, the failure mode is specific and predictable: the model trains on unrepresentative data, achieves good accuracy on the training set, and then fails immediately in production when the real-world data distribution differs from what it learned. This is the most common cause of AI forecasting project failure — and it is invisible in a vendor demo.
Diagnostic question for your own implementation: Can you confirm that every major driver of demand variation in your business for the past 24 months has a corresponding data record? If promotions, stockouts, weather events, or competitive actions are not captured in your historical data, your data foundation requires preparation before any model can be trained.
The pattern engine is the machine learning model trained on the data foundation. It learns the statistical relationships between input variables—weather, promotions, and economic conditions—and actual demand outcomes. For each new prediction period, it applies those learned relationships to current input data to estimate future demand.
Gradient boosting models—which build sequential decision trees where each tree corrects the errors of the previous one — are the most commonly used architecture for demand forecasting because they handle complex, non-linear relationships between variables effectively and produce predictions that are interpretable enough for business planners to scrutinise and challenge. For time-series problems with strong seasonal cycles, recurrent neural networks or transformer architectures can outperform gradient boosting. For most production implementations, an ensemble approach — combining multiple model types — produces the most robust predictions because different architectures capture different types of patterns in the same dataset.
The counter-intuitive finding that most buyers do not encounter: the most sophisticated model architecture is rarely the most accurate model for a given business. Amazon’s forecasting research has shown consistently that simpler models trained on higher-quality data outperform complex models trained on noisy, incomplete data in the majority of tested cases. This is the Layer 1 dependency at work: a gradient boosting model trained on clean, complete, signal-rich data will outperform a transformer architecture trained on incomplete data without external signals. Spending on model complexity before resolving data quality is the most expensive mistake in AI forecasting investment.
When Layer 2 is applied incorrectly: a vendor proposes a single model architecture without testing alternatives, or presents impressive validation metrics from a benchmark dataset rather than from the client’s own historical data. Model accuracy on a held-out sample from your specific data, validated against a period that reflects your real production conditions, is the only accuracy metric that matters.
Diagnostic question: Has the proposed AI forecasting vendor tested at least two model architectures on your specific data and reported validated accuracy on a holdout period of at least six months drawn from your actual business history?
The prediction output is what the business actually uses: a forecast of expected demand for each SKU, product category, or service for each time period in the planning horizon. A production AI demand forecasting system does not produce only a point forecast — “we expect to sell 450 units next week.” It produces a confidence interval: “we expect to sell between 380 and 530 units next week, with 90% probability.”
The confidence interval is the operationally critical element that most buyers do not know to ask for. It determines how much safety stock to carry for each product. A wide interval means high uncertainty, which means more safety stock is required to avoid a stockout. A narrow interval means high confidence, which means safety stock can be reduced without increasing stockout risk. A system that outputs only point forecasts forces inventory planners to apply a single uniform safety stock rule across all products regardless of their individual uncertainty levels—which systematically over-stocks low-uncertainty products and under-stocks high-uncertainty ones. That is exactly the pattern that produces inventory distortion.
The counter-intuitive finding in this layer: most businesses implementing AI forecasting focus on reducing mean absolute percentage error—the accuracy of the point forecast. The businesses that extract the most financial value focus on confidence interval calibration — the accuracy of the uncertainty estimate. A well-calibrated confidence interval enables dynamic safety stock: aggressive inventory reduction on high-confidence products, conservative safety stock on uncertain ones. Most of the carrying cost savings identified by McKinsey come from this dynamic safety stock optimization, not from the point forecast accuracy improvement alone.
When Layer 3 is incomplete, the system produces only point forecasts. Inventory planners apply uniform safety stock rules. The net result is persistent inventory distortion—overstocked on some products, understocked on others—even though the underlying model is technically functional.
The learning loop is the operational system that keeps the model accurate over time. It has three components: accuracy monitoring—a weekly comparison of predicted versus actual demand with automated alerts when forecast error exceeds defined thresholds; drift detection—statistical tests that identify when input data distributions have shifted enough to invalidate the model’s learned relationships; and a retraining pipeline—automated or scheduled model retraining on updated data to restore accuracy when drift is detected.
Model drift is the most misunderstood failure mode in AI forecasting. A demand forecasting model trained in January 2024 learned the relationships between variables and demand as they existed from 2021 to 2023. By January 2025, those relationships have changed: a new competitor has entered the market, consumer preferences have shifted toward a substitute product, and a supply chain disruption has changed the availability patterns the model was trained on. The model does not know this. It continues producing predictions based on the old relationships—and its accuracy degrades silently, week by week, until someone notices the forecast errors have grown and cannot explain why. This is model drift. Without Layer 4, every AI demand forecasting system eventually fails.
Procter and Gamble has described publicly that their AI demand sensing system generates short-horizon demand predictions updated daily—incorporating continuous model updating as new point-of-sale data arrives from retail partners. The system does not wait for a scheduled quarterly retraining. It updates predictions and learned patterns simultaneously in a rolling window architecture, allowing it to respond to market shifts within days rather than quarters. That continuous learning capability is Layer 4 operating at enterprise scale.
When Layer 4 is absent: a business deploys an AI forecasting model, sees strong results in the first six months, and then experiences a gradual increase in forecast error over the following twelve to eighteen months. The error is attributed to market complexity rather than model degradation. The business concludes that AI forecasting stopped working — when in fact the model was never given the mechanism it needed to keep working.
The team at apidots.com includes automated drift detection, retraining pipelines, and accuracy reporting dashboards as standard components of every production AI demand forecasting system. The cloud services infrastructure that supports these monitoring pipelines is designed for the same reliability and SLA requirements as any other production business system — not as an optional monitoring add-on.
Diagnostic question: Does your proposed forecasting system include automated drift detection and a scheduled or triggered retraining pipeline? If these are described as future-phase additions or optional service charges, you are looking at a system that will degrade.
| Missing layer | What breaks | What it looks like in production |
|---|---|---|
| Layer 1: Data Foundation | Model learns from incomplete or biased data | High training accuracy, immediate production failure. Looks good in the demo; fails in the first real week |
| Layer 2: Pattern Engine | Wrong model architecture applied to the data | Accuracy lower than expected. Vendor attributes failure to data quality—but the real problem is an untested, one-size-fits-all model |
| Layer 3: Prediction Output | Point forecasts only, no confidence intervals | Inventory planners apply uniform safety stock. Overstocks low-uncertainty products; understocks high-uncertainty ones. Net result: inventory distortion persists despite AI investment |
| Layer 4: Learning Loop | Model accuracy decays as market conditions change | Strong first six months; growing error from month seven to eighteen; declared a failure by month twenty-four despite working correctly at launch |
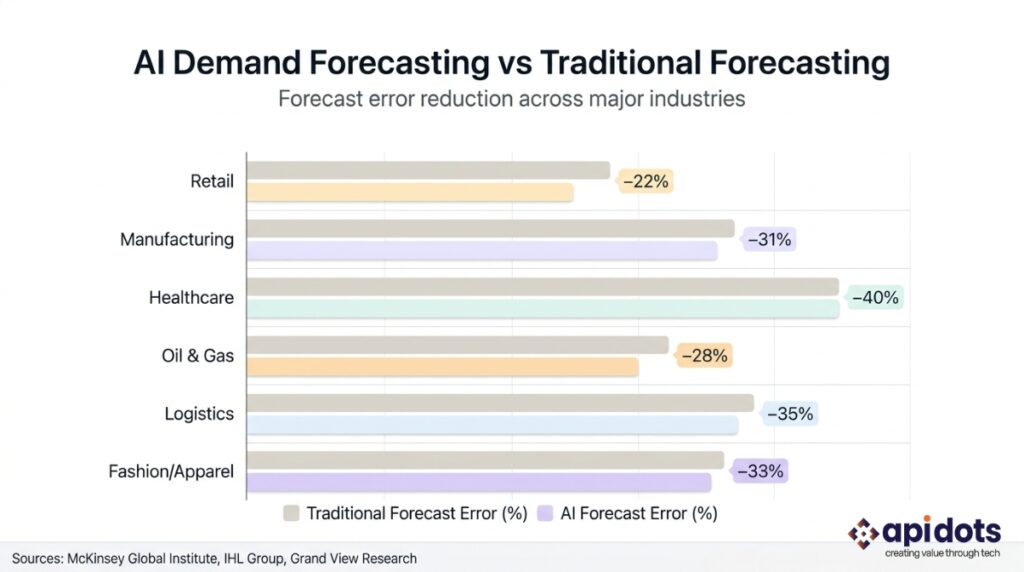
The performance improvements from AI demand forecasting are documented at scale across multiple industries. McKinsey’s research on AI in supply chain operations shows that organizations deploying AI-powered demand forecasting reduce forecast errors by 20 to 50% compared to traditional statistical models while simultaneously cutting inventory carrying costs by 20 to 30% and improving service levels. The combination of these three improvements — more accurate forecasts, less inventory, fewer stockouts—is what generates the return on investment that makes AI demand forecasting one of the highest-ROI AI applications in operations management. The compounding dynamic is the key: accuracy improvement reduces safety stock requirements, safety stock reduction cuts carrying costs, and both improvements together are what shortens payback periods to 6 to 18 months.
The performance gap between AI forecasting and traditional forecasting is widest when demand is most complex. For simple, stable products with consistent seasonal patterns, a traditional statistical model can perform adequately. For products with irregular demand influenced by many variables simultaneously—fashion items, consumer electronics, perishable foods, energy commodities—the AI advantage is structural and persistent.
Amazon reduced stockouts by approximately 20% while cutting excess inventory simultaneously. The mechanism was ML demand forecasting that updates continuously as new order data arrive—not batch updates nightly. The business implication: same-day delivery promises became operationally feasible because inventory position accuracy improved enough to support them.
Walmart processes over 200 external variables for 4,700 US stores, updating daily. The mechanism was weather and local event data integrated at the individual store level — not averaged across a region. The business implication: hurricane preparedness stock for a Florida store is calculated specifically for that store’s catchment area and its specific customer demographic, not for the Southeast region as a whole.
Zara forecasts fashion demand twelve weeks ahead using social media trend data and early-season sell-through signals. The mechanism was a model retrained weekly on current-season data — a continuous learning loop rather than an annual model refresh. The business implication: in-season production decisions respond to demand signals that competitors using traditional annual buying cycles will not detect until the following year’s planning season.
Procter and Gamble’s AI demand sensing reduces weeks of supply across its global distribution network. The mechanism was daily updates from retail POS data partners — not lagged monthly order data. The business implication: upstream production planning responds to real consumer shelf movement, not the distorted order signal that accumulates as orders pass through the distribution chain.
California’s AI demand forecasting adoption runs across two distinct industry contexts that rarely appear in the same analysis. The state’s retail sector — including major e-commerce operations headquartered in San Jose and apparel and consumer goods brands centered in Los Angeles — faces demand patterns heavily influenced by social media trend cycles. AI forecasting models that incorporate social media sentiment alongside sales history are production-deployed by California brands operating in fashion, beauty, and consumer electronics, where a product’s demand lifecycle can compress from twelve months to six weeks based on a single viral moment. Separately, California’s agricultural sector — the largest in the US — is actively adopting AI demand forecasting for crop production planning and fresh produce supply chain management, where weather sensitivity makes traditional seasonal averaging particularly unreliable.
Texas presents the most technically complex AI demand forecasting environment in the country. The state’s oil and gas industry, headquartered primarily in Houston, was an early adopter of AI demand forecasting for refinery production planning and LNG cargo scheduling — energy demand forecasting requires simultaneous processing of price signals, weather patterns, geopolitical developments, and shipping logistics at a speed no human planning team can match. The state’s manufacturing sector, spread across Dallas-Fort Worth, San Antonio, and the Gulf Coast, uses AI forecasting for production planning and raw materials procurement. For the complete analysis of how AI applies across upstream, midstream, and downstream energy operations, the API DOTS oil and gas AI guide covers the specific data architectures and model types that energy demand forecasting requires.
Illinois sits at the center of the US logistics and supply chain network. Chicago-based distribution companies and third-party logistics operators use AI demand forecasting to optimise warehouse capacity, labour scheduling, and carrier booking. The Chicago distributor case study later in this article is a direct example of what AI demand forecasting delivers for a Midwest distribution business. The state’s manufacturing sector uses AI for production scheduling and raw material procurement against customer demand signals that shift frequently and with short notice.
New York’s retail and fashion industries, centered on Manhattan, use AI demand forecasting for seasonal product planning where trend cycles move faster than traditional quarterly buying processes allow. Financial services firms across Midtown and downtown Manhattan use AI-powered demand sensing for treasury and liquidity management, where the demand for financial products changes by the hour rather than the week.
Ohio’s manufacturing sector — automotive, consumer goods, and industrial equipment — uses AI forecasting for production scheduling and raw material procurement, particularly for businesses in supply chains where OEM demand signals change significantly week to week. Florida’s hospitality and tourism operators, where seasonal demand is among the most variable in the country, use AI forecasting for hotel occupancy, restaurant supply chains, and seasonal retail — with models that treat a hurricane-season forecast and a spring-break forecast as fundamentally different demand environments requiring different external signal inputs. Georgia’s distribution corridors and Washington state’s aerospace supply chain — particularly relevant for Boeing component scheduling — apply the same probabilistic model structures used in industrial manufacturing forecasting across the country.
Working out whether your business data is ready for AI demand forecasting? The team at apidots.com offers a free 30-minute scoping call. We will review what data you have, define your forecasting problem precisely, and give you an honest answer about what is possible. No pitch. Just answers. Book a Free Scoping Call
A mid-size consumer goods distributor based in Schaumburg, Illinois distributes 3,800 active SKUs to 220 retail accounts across Illinois, Indiana, Ohio, and Michigan. Annual revenue of approximately $180 million. The company operated on a traditional demand planning system using 12 months of sales history and a static seasonal index built from historical data. No external signals. No confidence intervals. No retraining process.
Their forecast accuracy — measured as the percentage of SKUs forecast within 10% of actual weekly sales — was 44%. More than half of their products were forecast with greater than 10% error every week. The consequences were both simultaneous and expensive: their warehouse was carrying 18 weeks of supply on average against an industry benchmark of 8 to 10 weeks, and their fill rate to retail accounts was 91.3% against a target of 96%. Overstock generated carrying costs and forced markdowns. Stockouts generated lost sales and account penalty charges from major retail customers. Both problems were costing money at the same time — exactly the inventory distortion dynamic the $1.73 trillion figure captures.
The team at apidots.com built an AI demand forecasting system trained on 36 months of sales history combined with four external signal inputs: weekly weather data for the Midwest region, a regional economic activity index, promotional calendar data from the company’s trade marketing system, and sell-through data from three retail account POS feeds that the accounts agreed to share. Gradient boosting was selected as the model architecture because of the complex non-linear interactions between promotional timing, weather, and demand in this specific dataset — and because gradient boosting produces interpretable predictions that the business planning team could review and challenge during the validation phase. A six-month holdout period was used for validation specifically because the client’s business had significant quarter-over-quarter demand variation that a shorter holdout would not have captured. The system was integrated into the company’s ERP replenishment module via REST API, delivering weekly SKU-level forecasts with confidence intervals directly into the existing planning workflow. For further analysis of how AI inventory optimisation works in distribution environments, the smart AI inventory management guide covers the architectural principles in detail.
Results in the nine months following production deployment:
A Tier 2 automotive parts manufacturer headquartered in Stuttgart, Germany operates production facilities in Germany, Poland, and Monterrey, Mexico, serving automotive OEM customers across Europe and North America. Their forecasting challenge was a demand signal problem rather than a consumer demand problem: automotive OEM customers provide rolling 12-week demand signals that change significantly week to week, requiring the manufacturer to plan production and raw material procurement against highly uncertain forward demand without the ability to distinguish genuine plan changes from normal weekly signal noise.
Their traditional statistical forecast could not make that distinction. The production planning team either over-reacted to every signal change — creating production schedule chaos and expediting costs — or under-reacted and missed delivery commitments. Their on-time-in-full delivery rate was 87.4%, below the 95% threshold that automotive OEMs require to avoid supply chain penalty charges. The practical application of AI to manufacturing demand signal processing — and the specific model types that work for this class of problem — is covered in the API DOTS predictive ML guide for finance and manufacturing.
The system built was a probabilistic demand signal processing model trained on 48 months of OEM demand signals and actual production outcomes. The model assigned each weekly signal change a confidence score — the probability that the change reflected a genuine shift in OEM production plans versus normal signal volatility. Production planners received clear, actionable recommendations for each change: act on this signal adjustment versus absorb it through existing safety stock. The model was deployed across all three production sites simultaneously with shared signal processing infrastructure.
On-time-in-full delivery improved from 87.4% to 94.1% within eight months of production deployment. Production plan changes reduced by 28%, significantly cutting expediting and changeover costs that had been eroding margins on every order. The system now serves as the primary demand signal processing tool for the manufacturer’s global operations.
Most AI demand forecasting failures are not random. They follow three patterns consistent enough to predict and preventable enough that encountering them is not an acceptable outcome when the framework above makes them visible in advance.
Starting with a model instead of a data audit. Most AI forecasting implementations that fail do not fail because of the model. They fail because the historical data was not representative of future demand conditions, contained systematic biases from past business decisions, or lacked the external signal variables that actually drive demand in that industry. Yet most AI vendors lead with a product demo — which shows what the system can do given perfect data — not a data audit showing what it can do given your data. The team at apidots.com treats the data audit as a go or no-go gate. If the data cannot support a production model, the client is told before any development budget is committed. This is not standard practice. It is the differentiator that prevents the class of failure described in the Layer 1 section above. For the broader pattern of AI adoption failures that this reflects, the AI adoption strategy mistakes guide documents the failure modes across multiple implementation contexts.
Buying a forecasting dashboard instead of building a forecasting system. A dashboard shows better visualisations of data you already had. A forecasting system produces predictions of data you do not have yet and reduces the error in those predictions. The difference is enormous but invisible in a product demo. When evaluating vendors, ask: what is the model architecture, what external signals does it incorporate, and what is the validated forecast accuracy against a holdout period from your specific business data? If those three questions cannot be answered with specific documented responses, you are looking at a dashboard.
Deploying without Layer 4. A model trained today and left unchanged will degrade as market conditions evolve. Without a monitoring and retraining pipeline, forecast accuracy declines quietly — week by week — until someone notices the errors have grown enough to create operational problems. By that point, the business has already absorbed months of suboptimal inventory decisions that a learning loop would have prevented.
Score one point for each ‘Yes’ answer. Score 0 to 4: Data preparation required before model development can begin — start with a data audit. Score 5 to 7: Implementation ready with targeted preparation — specific gaps identifiable in a scoping call. Score 8 to 10: Strong candidate for immediate production build.
| # | Question | Why this matters |
|---|---|---|
| 1 | Do you have 24 or more months of clean, consistently labelled demand data? | Minimum data volume for seasonal pattern capture — Layer 1 foundation requirement |
| 2 | Do your historical records capture the reason for demand variation — promotions, stockouts, competitor events? | Without causality data, the model misattributes demand drivers — Layer 1 completeness gap |
| 3 | Have you identified the external signals that most influence your specific demand patterns? | External signal selection determines the ceiling of model accuracy |
| 4 | Can you access those external signals programmatically via API or data feed? | Manual data collection is too slow for production forecasting |
| 5 | Do you have a defined metric for forecast accuracy in your current process? | Without a baseline, there is no way to measure improvement |
| 6 | Do you have an ERP or planning system that can consume API-delivered forecast data? | Layer 3 output requires a consumption endpoint — integration readiness |
| 7 | Is there a business owner with budget authority and operational accountability for forecasting? | AI forecasting projects without an internal champion fail at a significantly higher rate |
| 8 | Can you allocate two to three business days of stakeholder time for the data audit phase? | The data audit requires business context that only internal stakeholders can provide |
| 9 | Is your business experiencing measurable forecast errors that are costing money right now? | The financial case must exist for the investment to be justified |
| 10 | Is your IT infrastructure capable of supporting an always-on forecasting system with daily data updates? | Production forecasting requires reliable infrastructure — Layer 4 operational requirement |
The AI forecasting market includes off-the-shelf SaaS platforms, BI tools with ML features, and custom ML development teams. These eight questions will help distinguish a production-ready solution from a well-designed demo — and will identify where each vendor’s process diverges from the Four Layers Framework.
| Question | Green flag | Red flag |
|---|---|---|
| What is your process before you start building a model? | Mandatory data audit with written go or no-go decision before any development begins | Demo offered immediately; no mention of data assessment |
| What model architecture will you use, and why? | Multiple architectures tested; selection justified by validation on client data | Single architecture proposed without testing alternatives; “our proprietary AI” framing without architecture disclosure |
| What validated accuracy did your model achieve on a holdout period from my specific data? | Specific MAPE or WMAPE reported against a client-defined holdout period of six or more months | Accuracy cited from benchmark datasets or competitor deployments — not client data |
| Do your forecasts include confidence intervals, or only point estimates? | Confidence intervals with calibration metrics included as standard | Point forecasts only; safety stock recommendations based on a single uniform uncertainty assumption |
| What does your learning loop and retraining process look like? | Automated drift detection, scheduled retraining, and accuracy monitoring included in base scope | Retraining offered as a future option or an additional service charge |
| How does the forecast output integrate with our existing ERP or planning system? | REST API integration with the client’s specific ERP confirmed in scope before contract | API integration described vaguely; ERP compatibility not confirmed before development begins |
| Who owns the model and the data after deployment? | Client owns source code, model weights, and data; full handover included | Vendor retains model; access conditional on continued subscription |
| What does a failed implementation look like, and how do you prevent it? | Specific failure modes described — Layer 1 data quality and Layer 4 absence — with documented prevention process | No failure scenarios discussed; demo shows only successful outcomes |
For US businesses evaluating the investment, here are honest cost ranges based on project scope and complexity:
| Engagement type | Cost range (USD) | Scope |
|---|---|---|
| Focused single-category system | $30,000 to $80,000 | Data engineering, model development, ERP integration, 90-day post-deployment monitoring |
| Full enterprise multi-category system | $80,000 to $250,000 | Multiple product categories, regions, or business units; data complexity and SKU count dependent |
| Ongoing maintenance and retraining | 15 to 25% of build cost annually | Drift detection, scheduled retraining, accuracy reporting, and feature additions |
The Chicago distributor case study above provides a concrete ROI reference point: a $180 million revenue business generating $2.8 million in first-year financial benefit represents a 1.6% revenue improvement from forecast accuracy alone. The payback period was six months. For businesses with higher carrying cost structures—perishable goods, consumer electronics, oil and gas, or pharmaceutical supply chains—the financial return per point of forecast accuracy improvement is proportionally higher because the per-unit cost of forecast error is greater. Grand View Research projects the global AI supply chain market to reach $41.23 billion by 2030, driven by documented ROI in demand forecasting applications. McKinsey’s supply chain AI research suggests that implementations in these contexts typically pay back the implementation cost within 6 to 18 months, with the shortest payback periods in sectors with the highest cost-per-error structures.
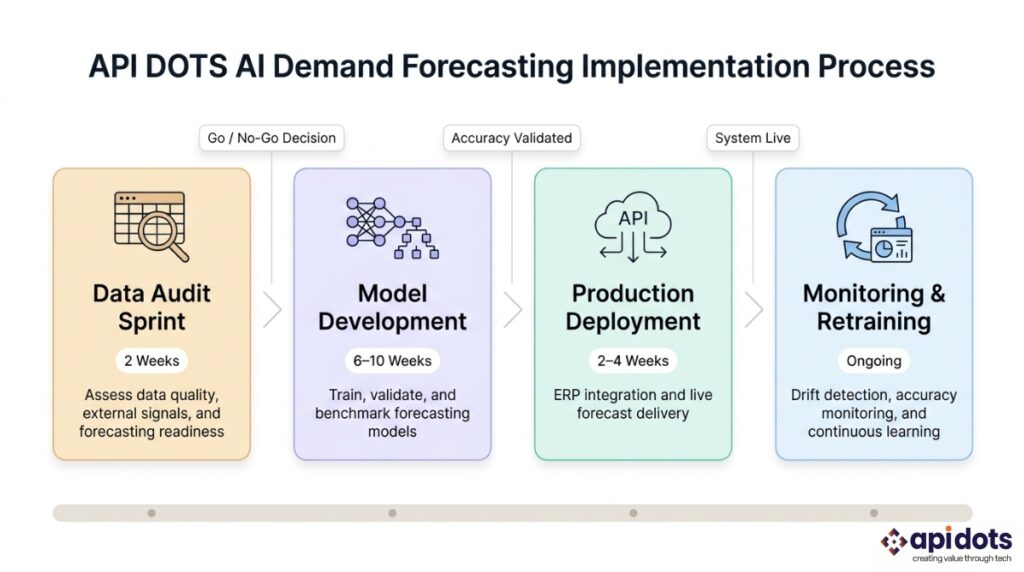
The team at apidots.com builds production AI demand forecasting systems for businesses in the US and globally—from mid-size Midwest distributors to national retailers, international manufacturers, and energy companies with multi-country operations. Every engagement follows four phases aligned directly with the Four Layers Framework described in this article.
Phase 1: Data Audit Sprint — 2 weeks. Assess data quality, completeness, and representativeness against the specific forecasting problem. Identify external signal variables relevant to the client’s demand drivers. Produce a written go or no-go report—including a list of data quality issues requiring resolution—before any development budget is committed. This is not optional. It is the step that prevents the class of failure described in the Layer 1 section above.
Phase 2: Model Development and Validation — 6 to 10 weeks. Test multiple model architectures against client-specific data. Validate accuracy against a holdout period of six or more months drawn from the client’s actual business history. Report MAPE, WMAPE, and confidence interval calibration metrics before production deployment is approved. No model goes to production without client-reviewed validation results.
Phase 3: Production Deployment and Integration — 2 to 4 weeks. Integrate the forecasting system with existing ERP, order management, or planning systems via REST API. Configure confidence interval outputs and accuracy monitoring dashboards. Confirm all integration points before go-live. No changes to existing operational workflows are required in most implementations — planners receive AI-generated forecasts as an additional input alongside the tools they already use.
Phase 4: Ongoing Monitoring and Retraining — Continuous. Automated drift detection, scheduled model retraining, and monthly performance reports delivered to the client’s operations leadership. Model accuracy maintenance is a standard component of every engagement — not an optional post-launch service.
For the complete technical methodology behind how every AI system is built from problem definition through post-deployment monitoring, the machine learning software development guide covers the full framework. For AI and ML development services specifically, the API DOTS practice overview documents the team structure and engagement models available.
Ready to build an AI demand forecasting system for your business? Whether you are a retailer in California, a manufacturer in Ohio, a logistics company in Illinois, or a global operation needing enterprise-scale forecasting across multiple countries and SKU sets, the team at apidots.com builds production forecasting systems that reduce forecast error, cut inventory costs, and improve service levels. Start with a free 30-minute consultation — no pitch, just a data readiness assessment and an honest answer about what is possible for your specific business. Contact API DOTS for a Free Consultation
What is AI demand forecasting?
AI demand forecasting is a system that uses machine learning to predict future product demand by analyzing historical sales data alongside real-time signals like weather, promotions, and competitor pricing. Unlike spreadsheet-based models, it updates continuously and outputs confidence intervals —not just point estimates — enabling more precise inventory decisions.
How accurate is AI demand forecasting?
According to McKinsey research, organizations using AI demand forecasting reduce forecast errors by 20 to 50% compared to traditional statistical models. Accuracy depends heavily on data quality and the number of external signals the model processes. The Chicago distributor case study in this guide achieved 71% SKU-level accuracy (within 10% of actual weekly sales), up from 44% with a traditional system.
What is the difference between AI demand forecasting and traditional demand forecasting?
Traditional demand forecasting applies a fixed formula to historical sales data. AI demand forecasting uses machine learning to discover the relationships between hundreds of variables—weather, promotions, economic conditions — without being given a formula in advance. The key practical difference: AI produces confidence intervals and updates predictions as new data arrives; traditional models produce a single number, updated on a planning cycle.
How much data do you need for AI demand forecasting?
The minimum is 18 to 24 months of clean, consistently labelled sales data for seasonal products, and 3 years to capture two full seasonal cycles. Data completeness matters more than volume — records must capture why demand varied, not just how much was sold. Missing context like promotions, stockouts, and competitive events will cause the model to misattribute demand drivers.
How long does it take to implement AI demand forecasting?
A focused single-category implementation typically takes 10 to 16 weeks: 2 weeks for data audit, 6 to 10 weeks for model development and validation, and 2 to 4 weeks for ERP integration and deployment. The most common cause of delays is data quality issues discovered during the audit phase.
What does AI demand forecasting cost?
For a focused single-category system, expect $30,000 to $80,000 for development, integration, and 90-day post-deployment monitoring. Full enterprise multi-category systems range from $80,000 to $250,000 depending on SKU count and data complexity. Ongoing maintenance — including model retraining and drift monitoring — typically runs 15 to 25% of the build cost annually.
Can AI demand forecasting integrate with SAP, Oracle, or other ERP systems?
Yes. Production AI demand forecasting systems connect to ERP and planning platforms via REST API, delivering forecast data and confidence intervals directly into existing workflows. No changes to how planners work are required — the AI forecast appears as an additional input alongside familiar tools. SAP, Oracle, Microsoft Dynamics, and NetSuite integrations are all standard configurations.
Which industries benefit most from AI demand forecasting?
The industries with the highest ROI are those where demand is most complex and forecast errors are most expensive. Oil and gas leads by financial magnitude ($200 billion in annual planning losses). Pharmaceutical and medical supply chains follow ($5 billion in expired supply waste). Fashion retail, consumer electronics, food distribution, and logistics all see structural advantages because AI can process the volume and variety of signals that drive demand in those sectors — far beyond what traditional tools can handle.
What is the ROI of AI demand forecasting?
McKinsey’s supply chain AI research shows payback periods of 6 to 18 months for most implementations. The ROI comes from three compounding improvements: reduced forecast error (20–50%), lower inventory carrying costs (20–30%), and fewer stockout events. A mid-size distributor at $180M annual revenue generated $2.8M in first-year financial benefit from a system that cost a fraction of that to build — a 6-month payback period.
We leverage AI, cloud, and next-gen technologies strategically.Helping businesses stay competitive in evolving markets.
Consult Technology Experts
I’m a digital marketer with experience in SEO, content strategy, and online brand growth. I specialize in creating optimized content, improving website rankings, building high-quality backlinks, and driving traffic through effective digital marketing strategies. I enjoy helping businesses strengthen their online presence and turn visitors into customers.